Boxplots Are Hiding Your Data. Here’s a Simple Fix
How overlaying raw data points reveals what your summary statistics quietly discard
Read on Substack ↗Filtering by tag: petrophysics (15)
How overlaying raw data points reveals what your summary statistics quietly discard
Read on Substack ↗Seven Steps From a Default Chart to Something Worth Publishing
Read on Substack ↗Build stacked KDE plots from scratch and with joypy to show shape, skew, and spread across multiple groups
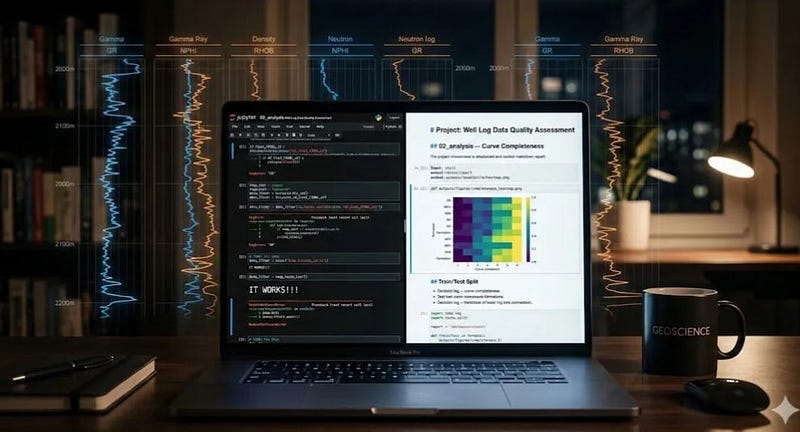
Read on Substack ↗From messy exploration to a record that still makes sense months later
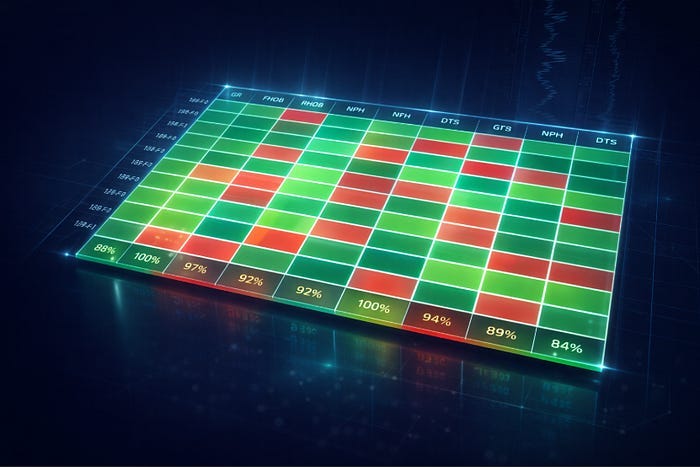
Read on Substack ↗Visualising Well Log Data Availability by Formation Across Multiple Wells
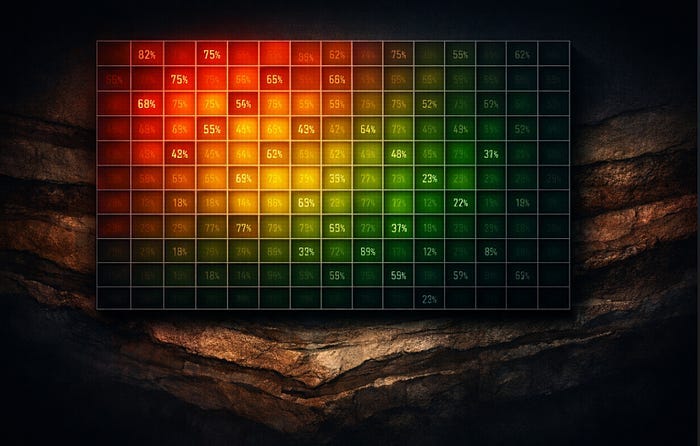
Read on Substack ↗Take a Basic Well Log Data Availability Heatmap and Make It Something Worth Putting in a Report
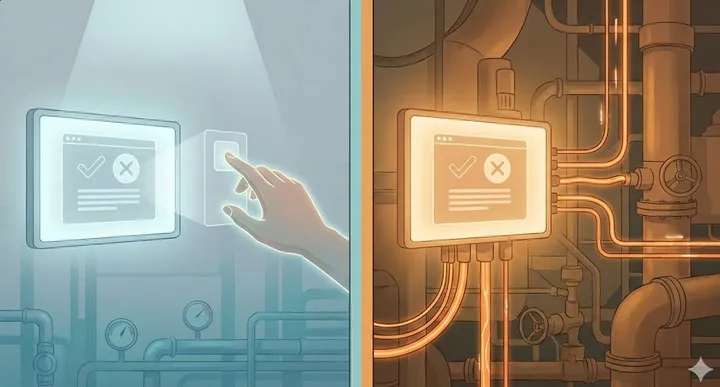
Read on Substack ↗Distinguishing between AI systems that suggest versus those that act autonomously is more critical than accuracy metrics alone.
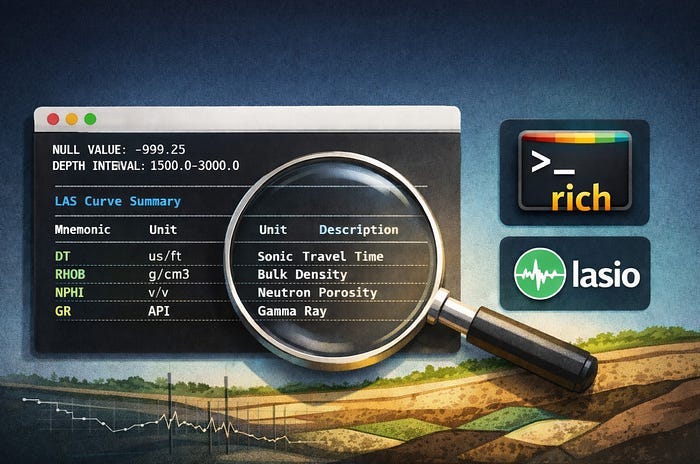
Read more →Building a coverage heatmap for LAS files using rich and lasio
Read on Substack ↗A practical approach to inspecting LAS files in Python without jumping straight to plots
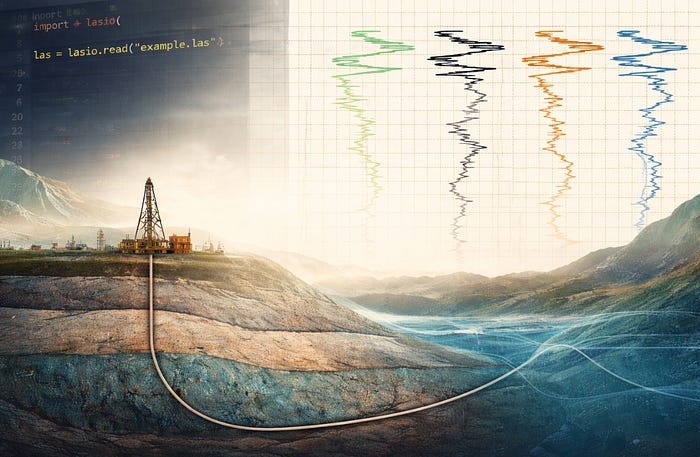
Read on Substack ↗A practical look at the LAS format, its structure, and how to work with it using lasio for subsurface well data
Read on Substack ↗A geoscientist’s approach to controlled AI-assisted coding
Read on Substack ↗I've been thinking a lot about how casually we use the word AI at the moment.
Read more →A simple way to understand parameters to the Archie Water Saturation equation using Python
Read more →How Python can help your daily subsurface geoscience workflows
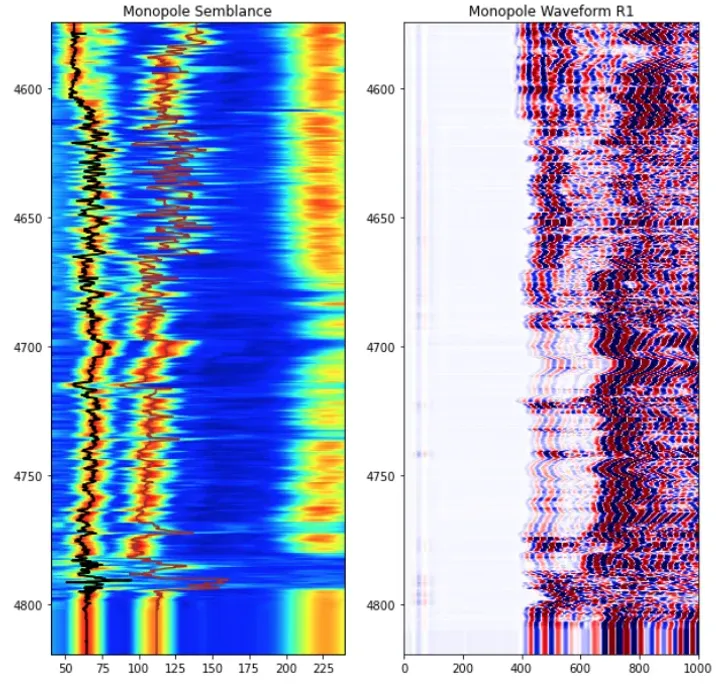
Read more →A short tutorial on loading and displaying processed acoustic waveform data using dlisio and matplotlib
Read more →