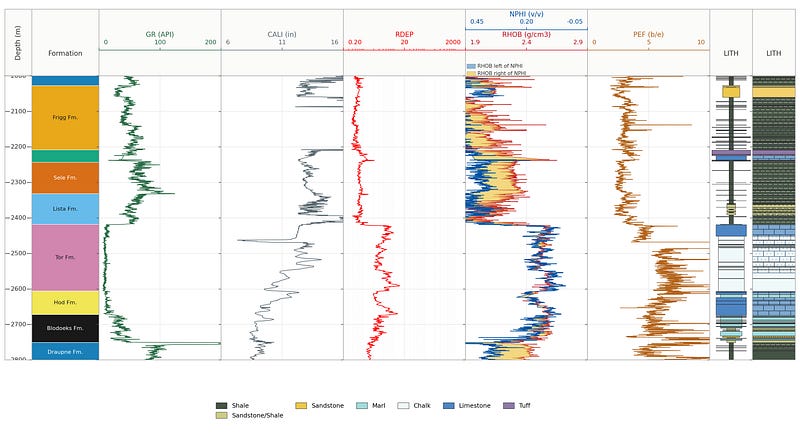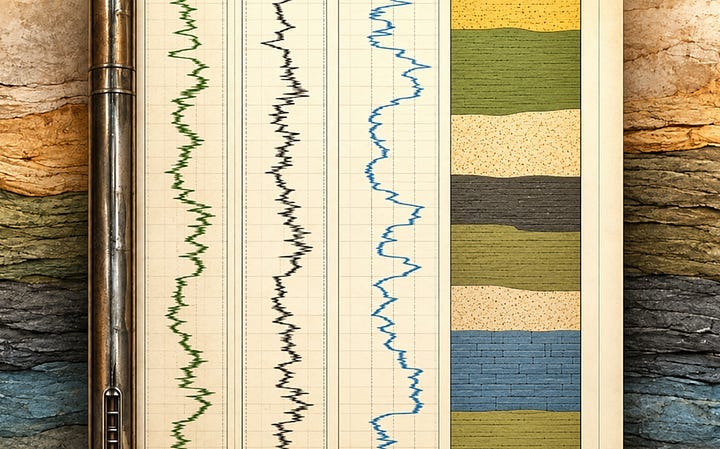
Adding a Geological Facies Display to a Well Log Plot in Matplotlib and Plotly
Adding a column of colour to a well log plot using Python
Read on Substack ↗Filtering by tag: visualisation (21)
Adding a column of colour to a well log plot using Python
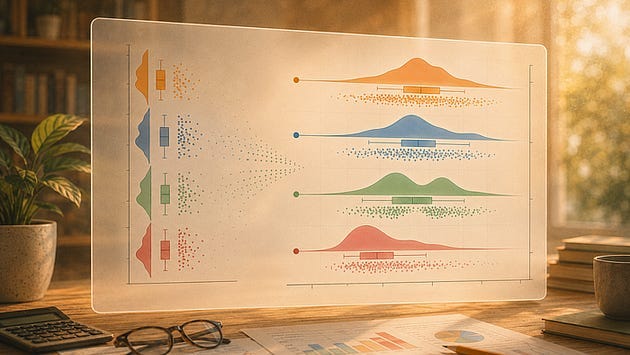
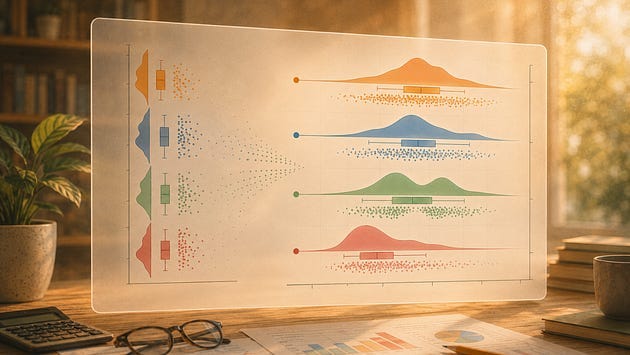
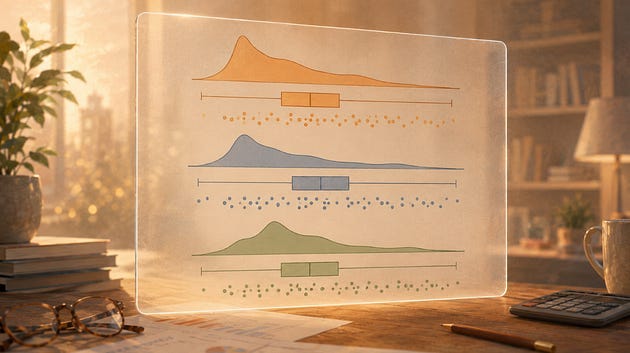
Read on Substack ↗Splitting, highlighting, connecting means, tuning the cloud, styling the rain, and knowing when to go vertical
Read on Substack ↗Past a handful of series, a line chart stops letting you follow any of them. Here is what breaks and what to plot instead
Read on Substack ↗How the number and position of bins can change what you think the distribution is telling you
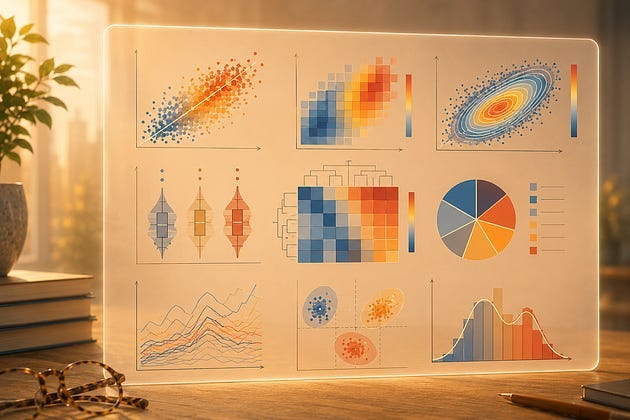
Read on Substack ↗Every chart has a blind spot. Learn where common scientific visualisations start to hide the patterns that matter.
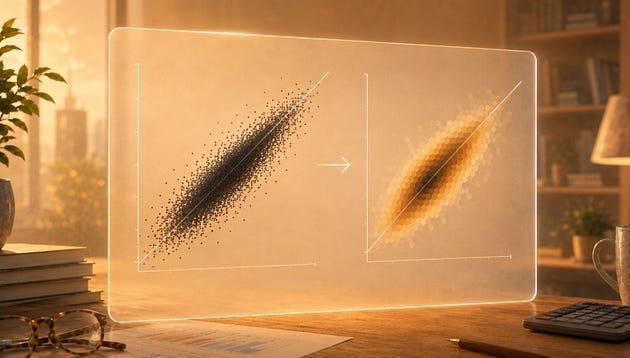
Read on Substack ↗Overplotting is easy to miss and easy to fix, once you stop asking your chart to show every point.
Read on Substack ↗Six steps between the chart ptitprince gives you and one you would want to put in a report
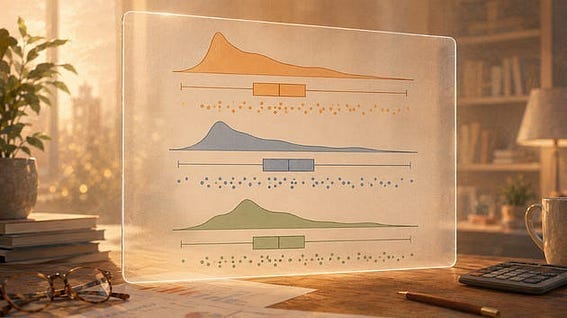
Read on Substack ↗Three views of your data distribution in one function call
Read on Substack ↗Constructing a raincloud plot one layer at a time
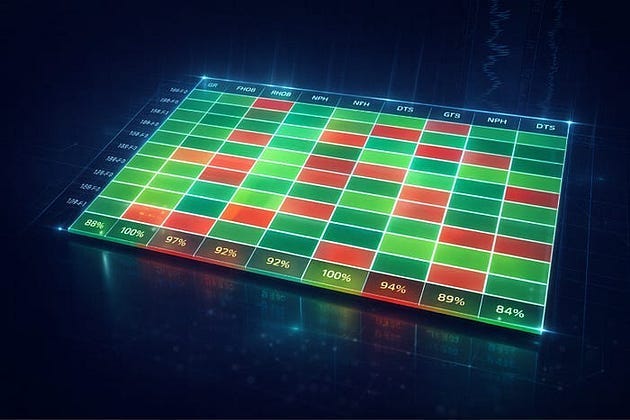
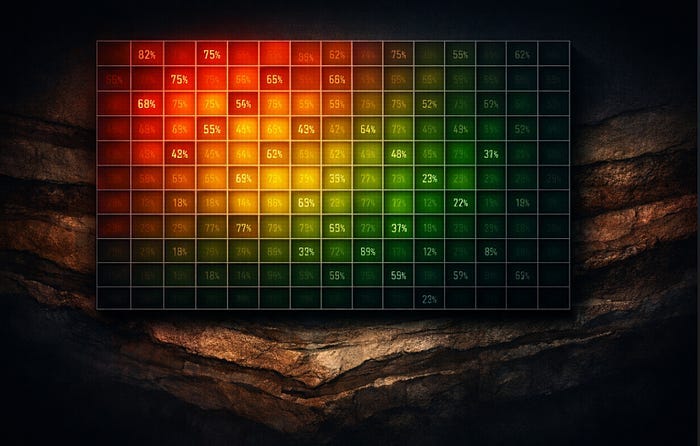
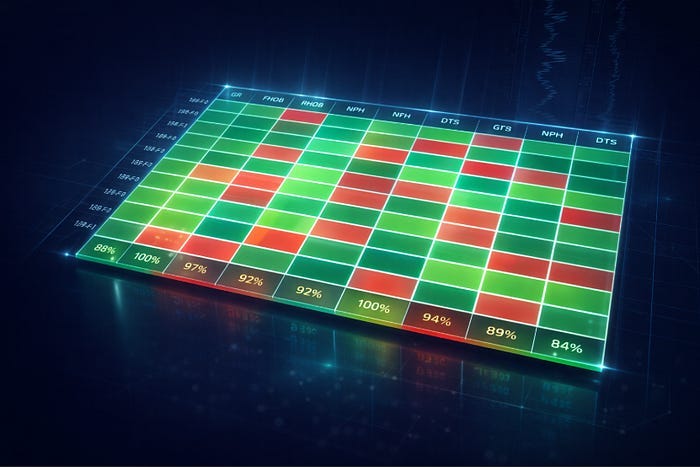
Read on Substack ↗Explore well log data completeness with interactive heatmaps
Read on Substack ↗How overlaying raw data points reveals what your summary statistics quietly discard
Read on Substack ↗Seven Steps From a Default Chart to Something Worth Publishing
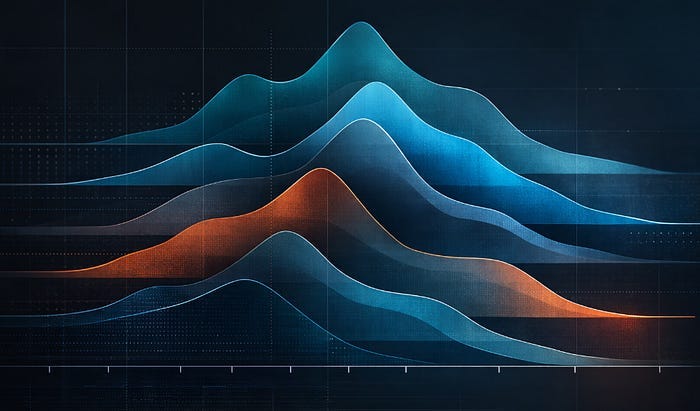
Read on Substack ↗Build stacked KDE plots from scratch and with joypy to show shape, skew, and spread across multiple groups
Read on Substack ↗Visualising Well Log Data Availability by Formation Across Multiple Wells
Read on Substack ↗Three underused chart types and when to reach for them when working with well log data
Read on Substack ↗Take a Basic Well Log Data Availability Heatmap and Make It Something Worth Putting in a Report
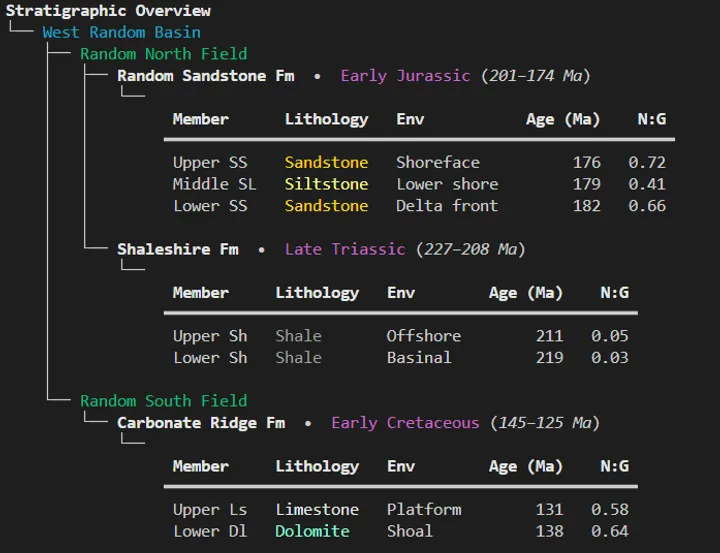
Read on Substack ↗Three simple libraries to make console output readable, useful and even stylish
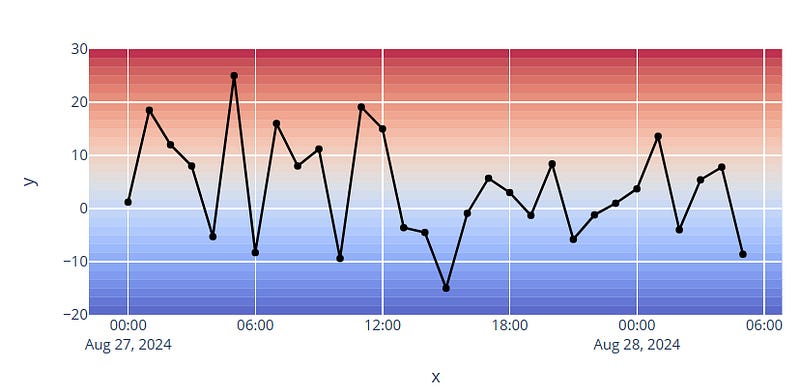
Read more →Using Plotly rectangle shapes to improve data visualisation
Read on Substack ↗A quick visual QC workflow using crossplots to surface tool issues and depth shifts.
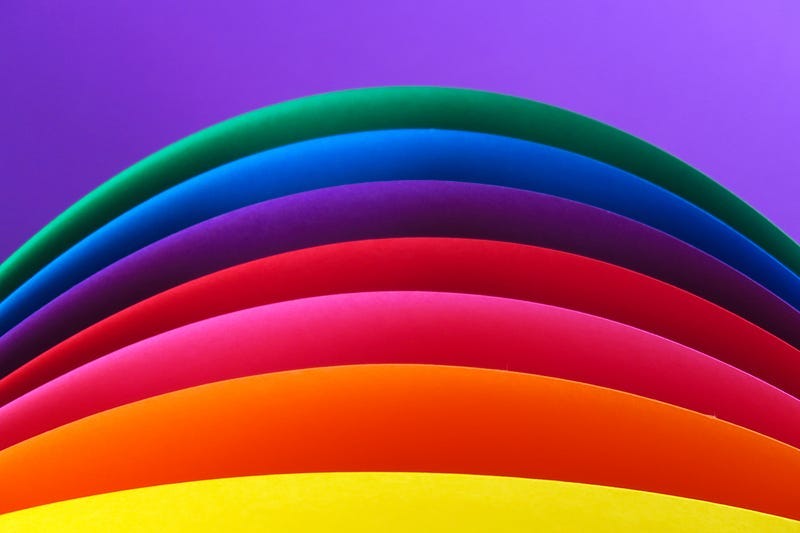
Read more →Tools for Making it Easy to Select Colour Palettes for Data Visualisations
Read on Substack ↗