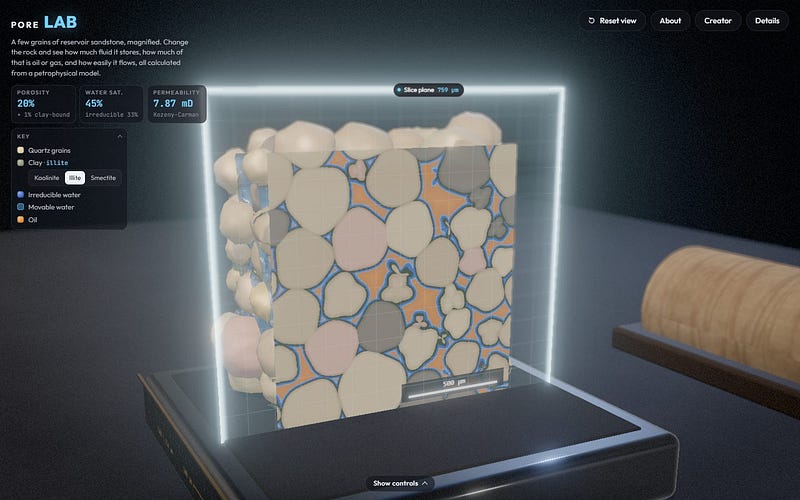
Pore Lab: Seeing Inside Reservoir Sandstone
From an X Post to a 3D Pore-Scale Simulator in an Hour
Read on Substack ↗152 articles on subsurface data, petrophysics, Python and AI, newest first. Articles marked Substack open on Subsurface Syntax.
From an X Post to a 3D Pore-Scale Simulator in an Hour
Read on Substack ↗Adding a column of colour to a well log plot using Python
Read on Substack ↗Splitting, highlighting, connecting means, tuning the cloud, styling the rain, and knowing when to go vertical
Read on Substack ↗Past a handful of series, a line chart stops letting you follow any of them. Here is what breaks and what to plot instead
Read on Substack ↗How the number and position of bins can change what you think the distribution is telling you
Read on Substack ↗Every chart has a blind spot. Learn where common scientific visualisations start to hide the patterns that matter.
Read on Substack ↗Overplotting is easy to miss and easy to fix, once you stop asking your chart to show every point.
Read on Substack ↗What label, ordinal, and one hot encoding each tell a model about your rocks
Read on Substack ↗Six steps between the chart ptitprince gives you and one you would want to put in a report
Read on Substack ↗Three views of your data distribution in one function call
Read on Substack ↗Constructing a raincloud plot one layer at a time
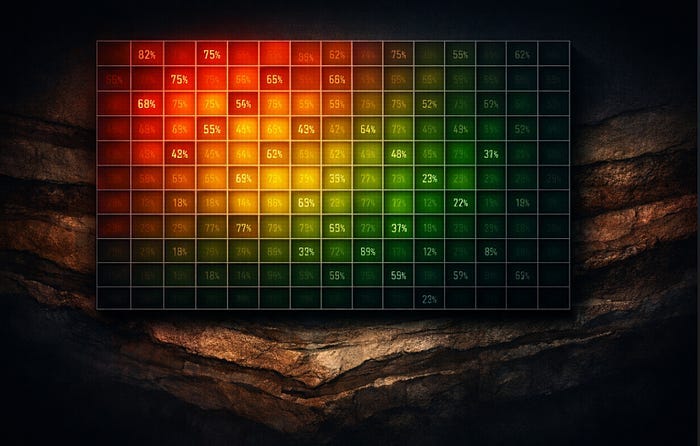
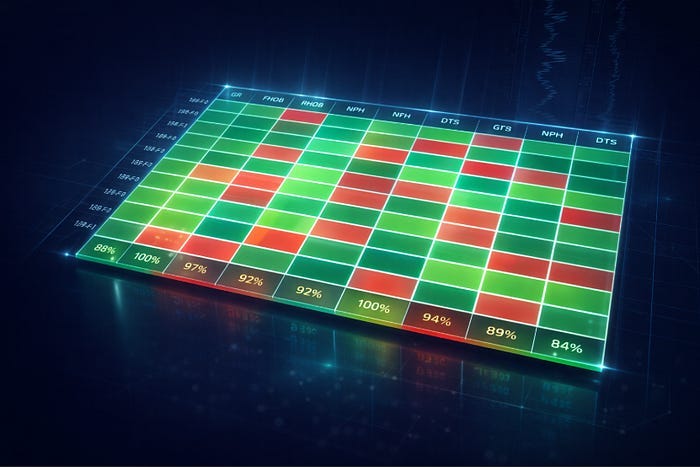
Read on Substack ↗Explore well log data completeness with interactive heatmaps
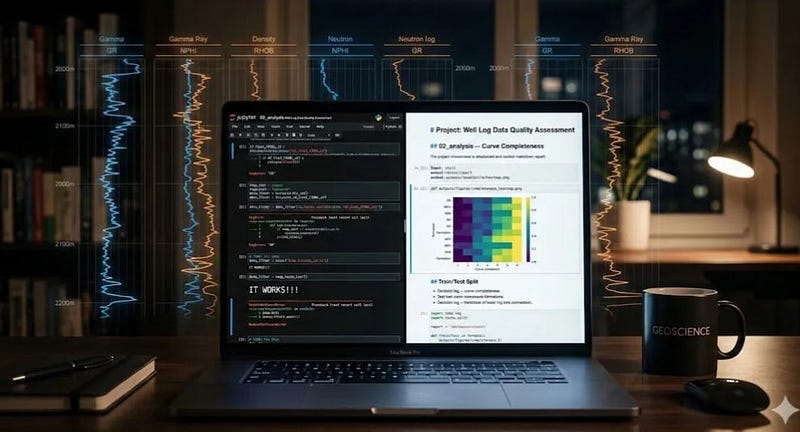
Read on Substack ↗Working code is only half the job. The reasoning needs to be readable too.
Read on Substack ↗Small adjustments. Large visual difference.
Read on Substack ↗Small habits that make notebooks easier to rerun and share
Read on Substack ↗How overlaying raw data points reveals what your summary statistics quietly discard
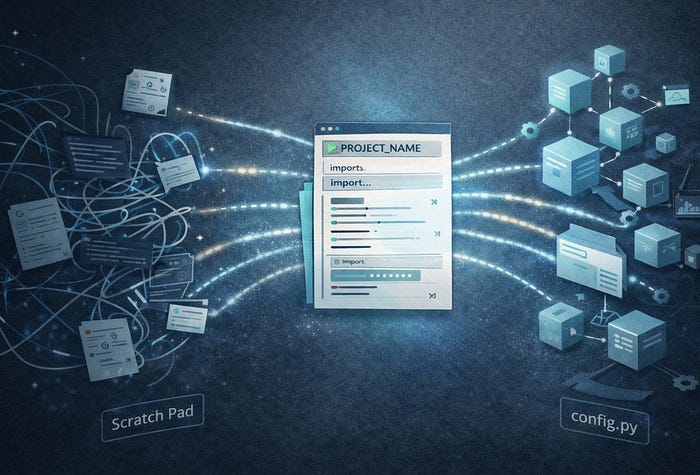
Read on Substack ↗A lightweight workflow for keeping notebook-heavy projects searchable, readable, and easy to return to
Read on Substack ↗Seven Steps From a Default Chart to Something Worth Publishing
Read on Substack ↗Notebooks are great for thinking. They are not always the right place to keep the machinery
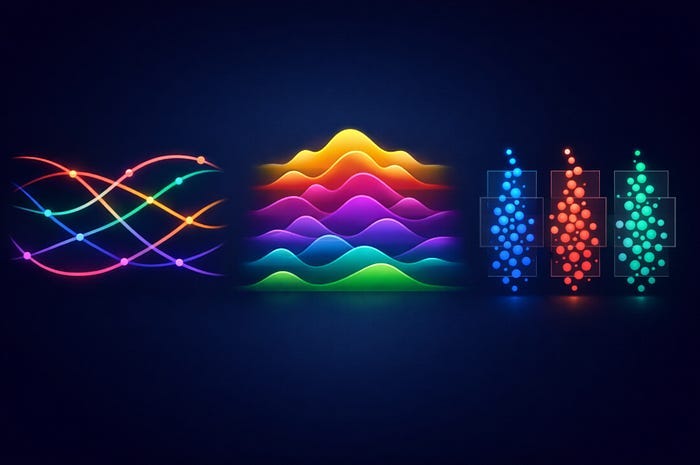
Read on Substack ↗Build stacked KDE plots from scratch and with joypy to show shape, skew, and spread across multiple groups
Read on Substack ↗Set it up once. Use it on every project.
Read on Substack ↗From messy exploration to a record that still makes sense months later
Read on Substack ↗Visualising Well Log Data Availability by Formation Across Multiple Wells
Read on Substack ↗Why missing specifications can result in behavioural drift in technical workflows
Read on Substack ↗Three underused chart types and when to reach for them when working with well log data
Read on Substack ↗Take a Basic Well Log Data Availability Heatmap and Make It Something Worth Putting in a Report
Read on Substack ↗Distinguishing between AI systems that suggest versus those that act autonomously is more critical than accuracy metrics alone.
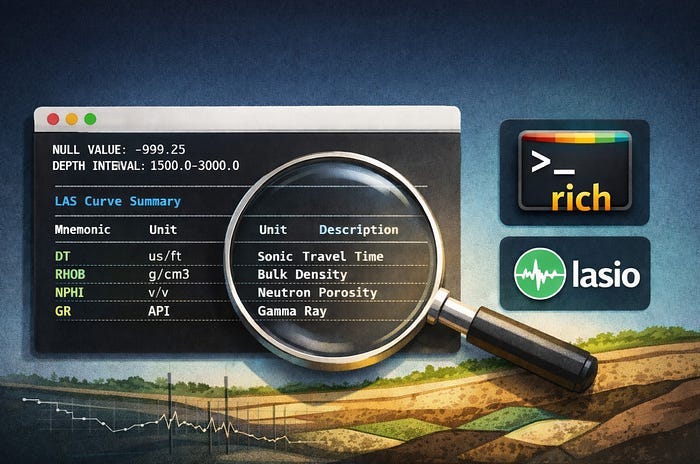
Read more →Building a coverage heatmap for LAS files using rich and lasio
Read on Substack ↗Understanding where AI excels and where it falls apart is the skill that actually matters
Read more →A practical approach to inspecting LAS files in Python without jumping straight to plots
Read on Substack ↗A practical look at the LAS format, its structure, and how to work with it using lasio for subsurface well data
Read on Substack ↗A geoscientist’s approach to controlled AI-assisted coding
Read on Substack ↗I've been thinking a lot about how casually we use the word AI at the moment.
Read more →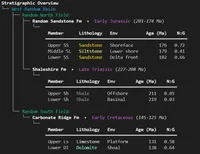 Tables, Pretty Prints, and Sanity: Python Output for Geoscience Data
 How to Open DLIS Files in Python with DLISIO
 Less Print, More Clarity: Debugging Python with Icecream and Snoop
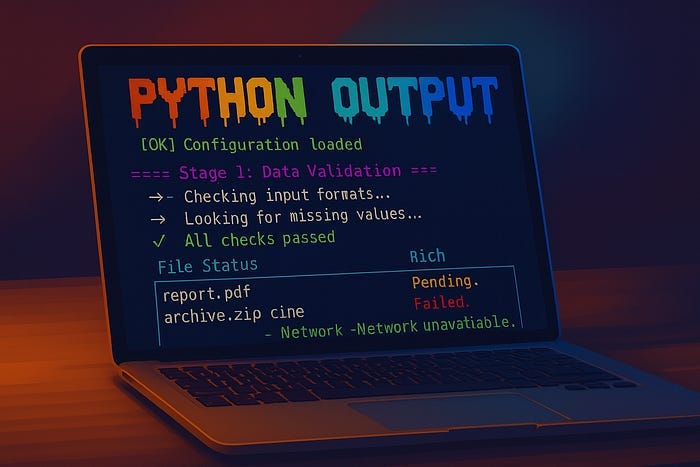 Bring Your Python Terminal to Life With Colour and Clarity
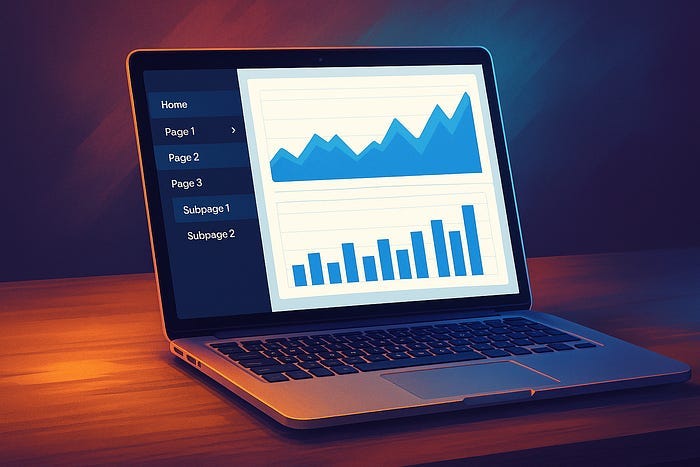 Add a Navigation Sidebar to Your Multi-Page Plotly Dash App (With Collapsible Menus)
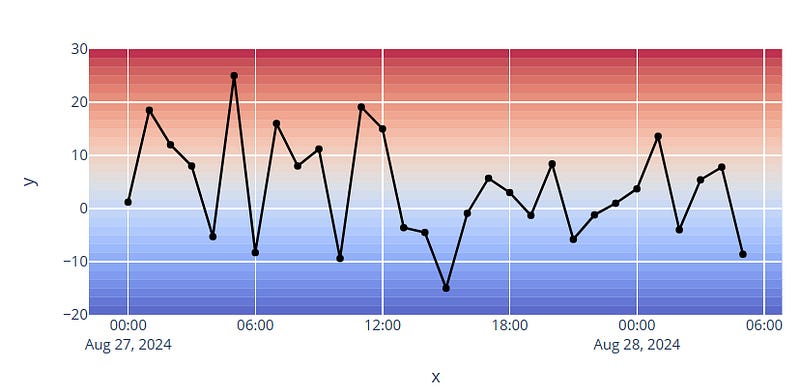 Adding Gradient Backgrounds to Plotly Charts
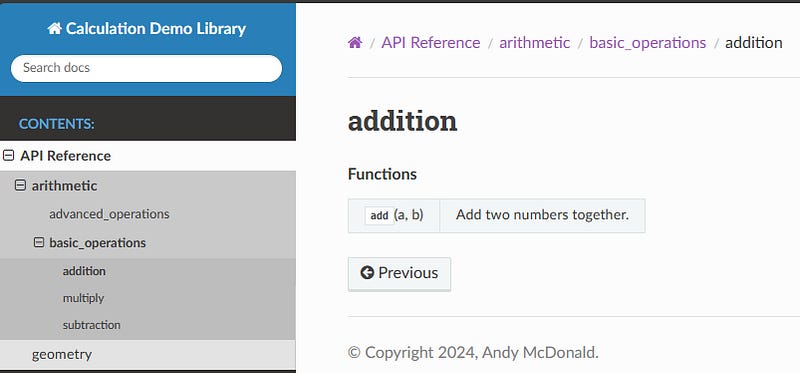 Sphinx-Autosummary: Creating Cleaner API Navigation Menus
 Using Python to Explore and Understand Equations in Petrophysics
 Python in Geoscience: An Essential Skill
 How to Structure and Organise a Streamlit App
 Getting Started With Python as a Geoscientist? Here Are 5 Ways You Can Improve Your Code!
 Unlocking Data from Graphs: How to Digitise Plots and Figures with WebPlotDigitizer
 Adding Inset Axes to Matplotlib Figures
 Well Log Measurement Prediction Using Neural Networks with Keras
 ChatGPT Advanced Data Analytics For Custom Matplotlib Well Log Plots
 4 Essential Resources to Help Improve Your Data Visualisations
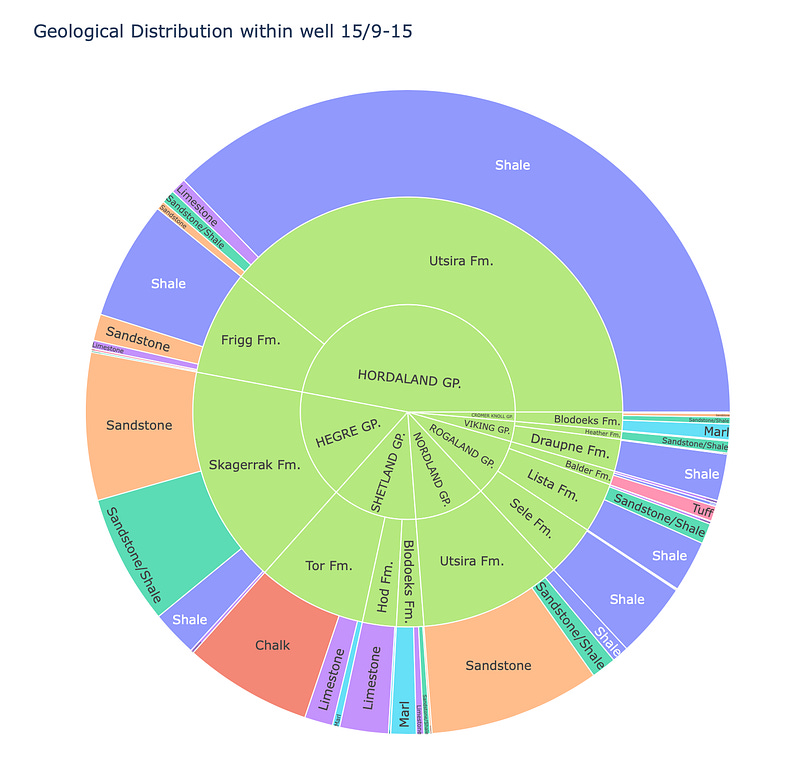 Using Plotly Express Sunburst Charts to Explore Geological Data
 Converting Well Logging Data From DLIS Files to LAS File Format
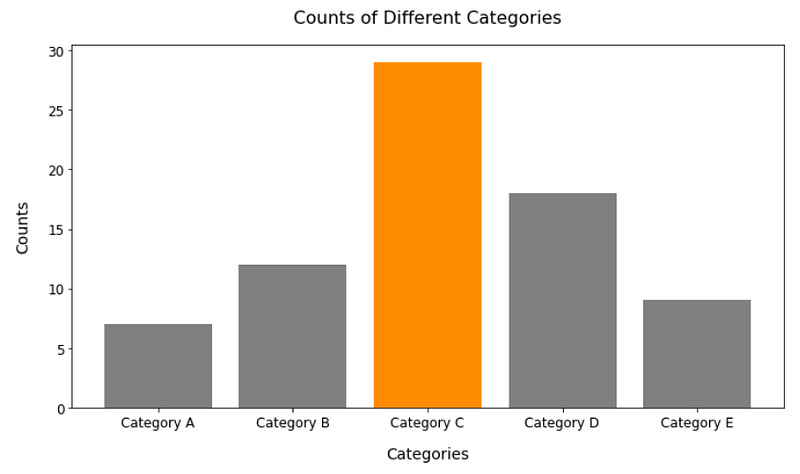 4 Easy Ways to Instantly Improve Your Data Visualisations
 Creating Scientific Plots the Easy Way With scienceplots and matplotlib
 Exploring the Contents of DLIS Files with Python
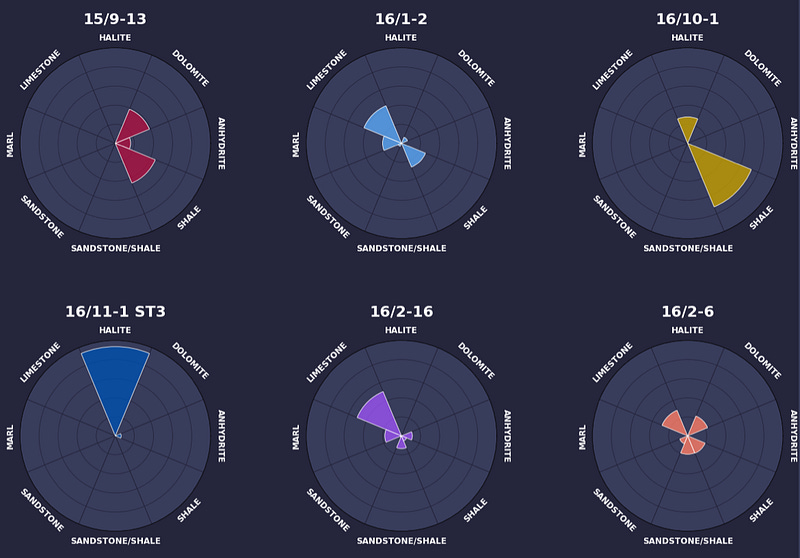 Creating an Infographic With Matplotlib
 Data Aggregation in Python with Pandas: Analysing Geological Lithology Data
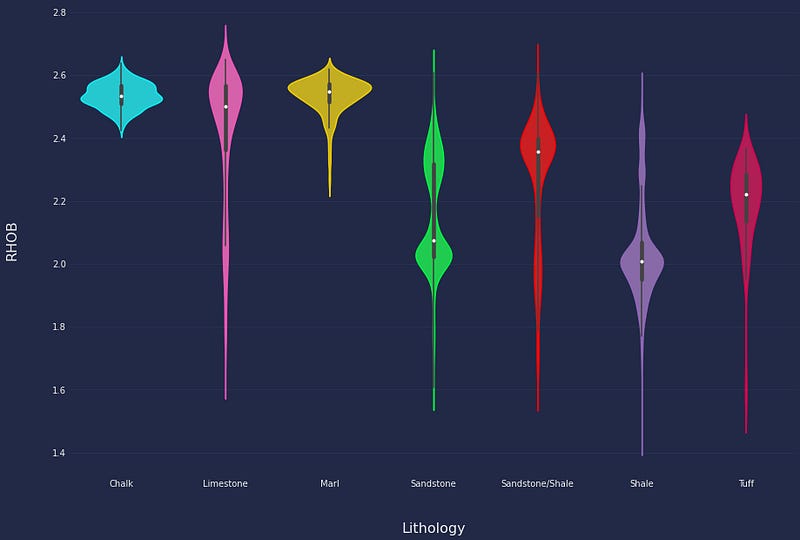 How To Create Cyberpunk-Styled Seaborn Violin Plots with Minimal Python Code
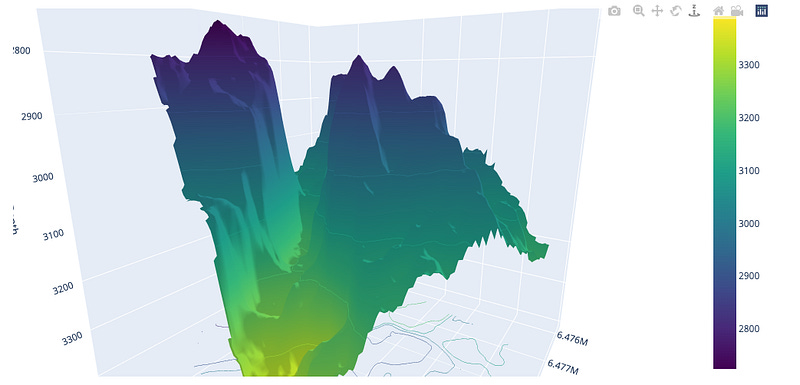 Using Plotly 3D Surface Plots to Visualise Geological Surfaces
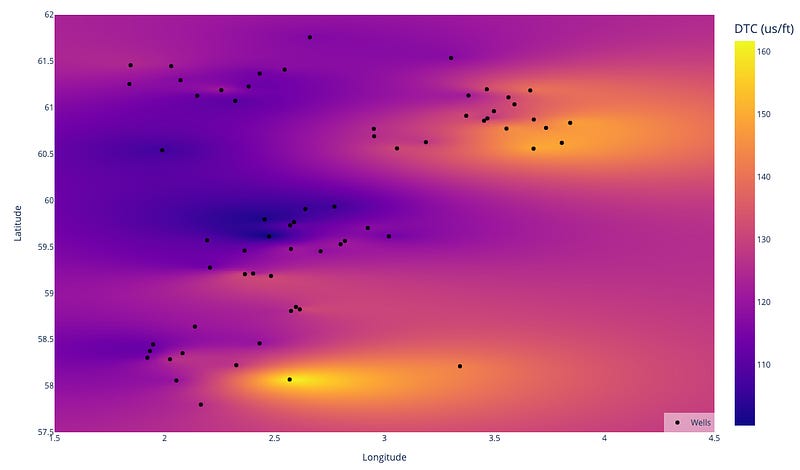 Plotly and Python: Creating Interactive Heatmaps for Petrophysical & Geological Data
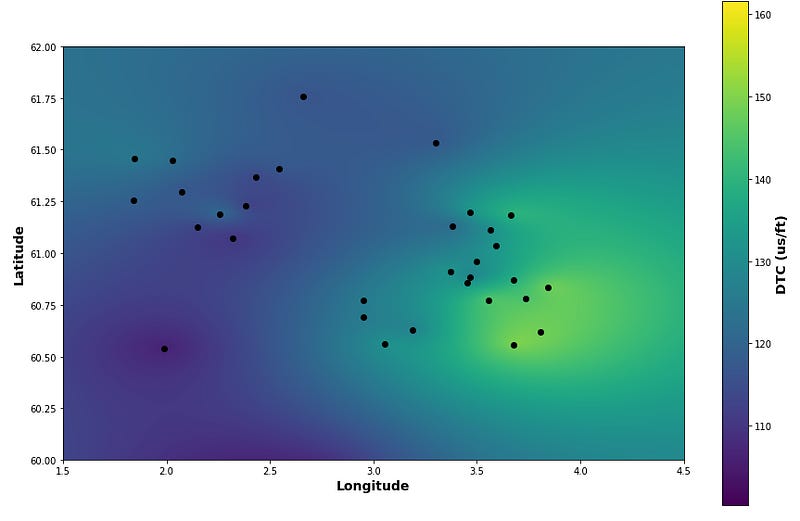 Utilising pykrige and matplotlib for Spatial Visualisation of Geological Variations
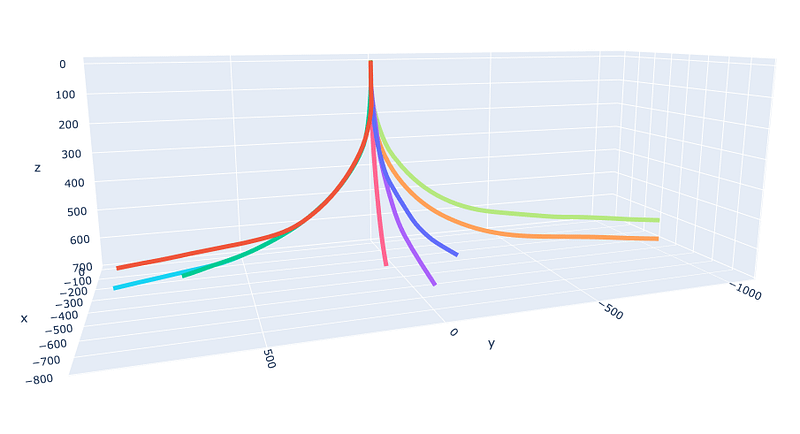 Visualising Well Paths on 3D Line Plots with Plotly Express
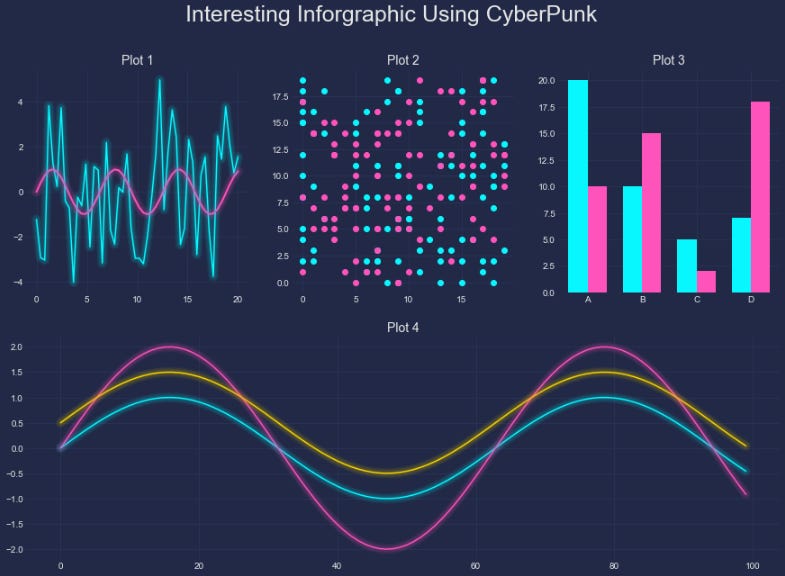 Cyberpunking Your Matplotlib Figures
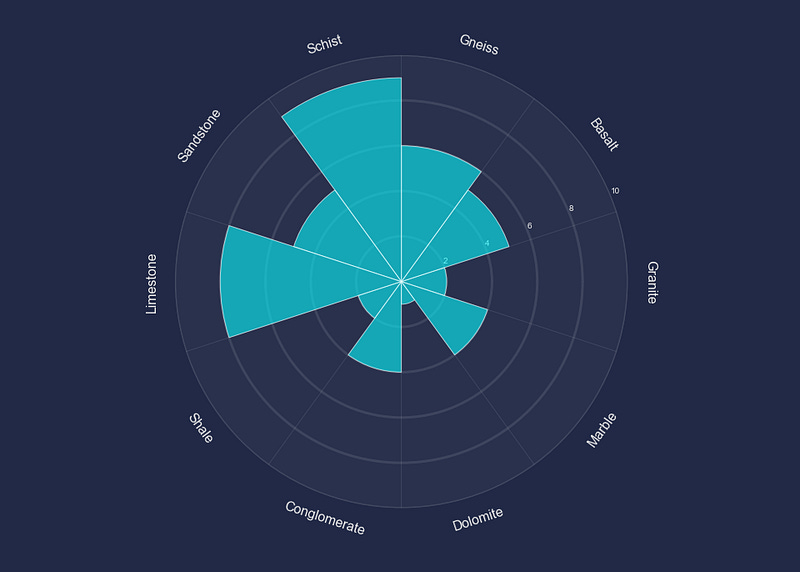 Enhance Your Polar Bar Charts With Matplotlib
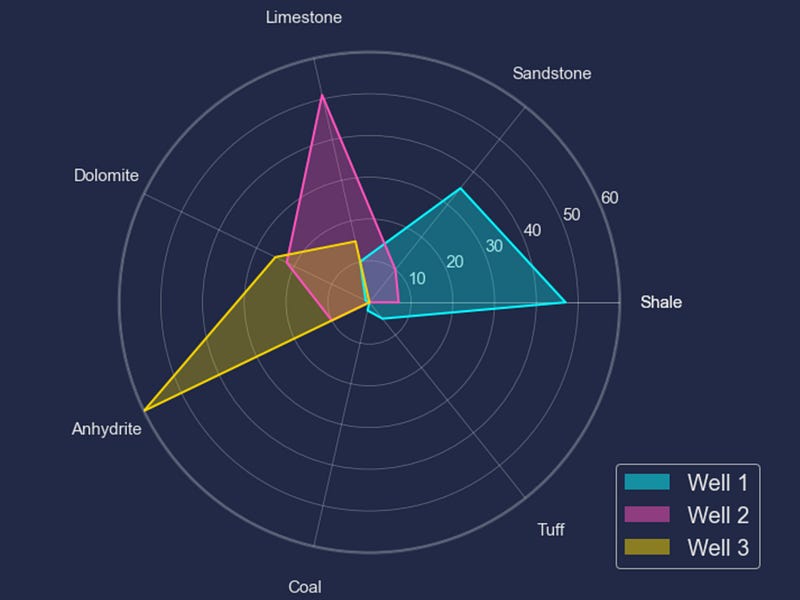 Create Stunning Radar Plots with Matplotlib
 Streamlit Tutorial: Creating Word Reports for Data Science Projects
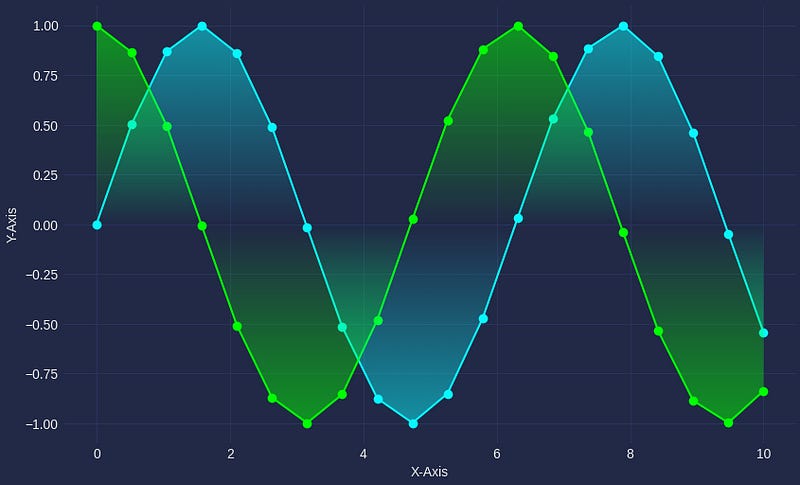 Upgrade Your Data Visualisations: 4 Python Libraries to Enhance Your Matplotlib Charts
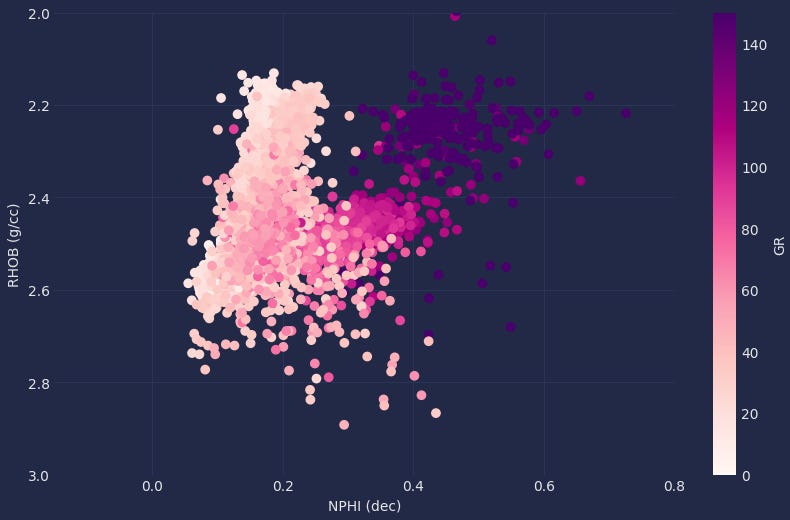 From Dull to Stunning: How Matplotx Can Improve Your Matplotlib Charts
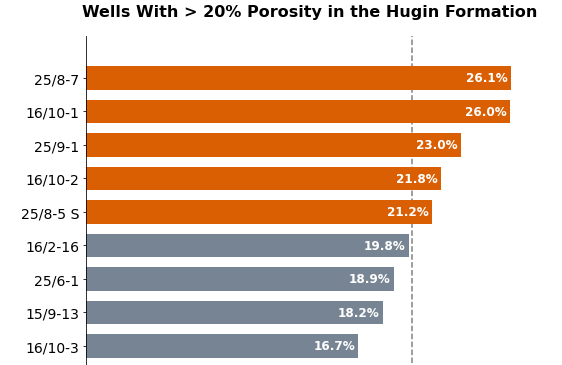 7 Steps to Help You Make Your Matplotlib Bar Charts Beautiful
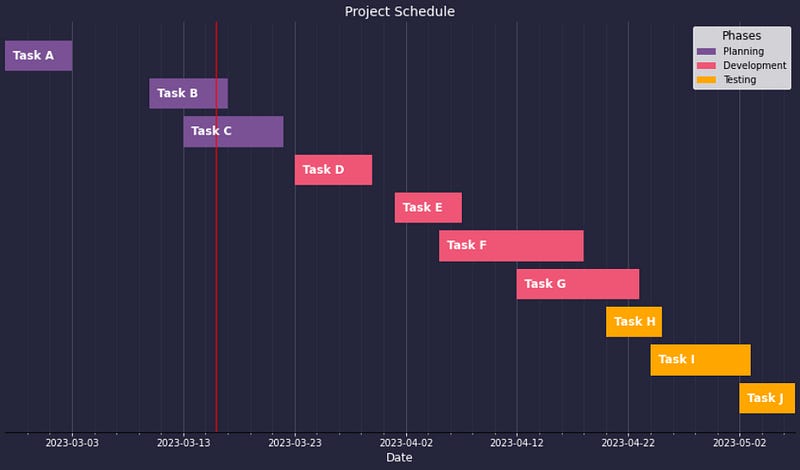 3 Unique Charts You Wouldn’t Think Were Created with Matplotlib
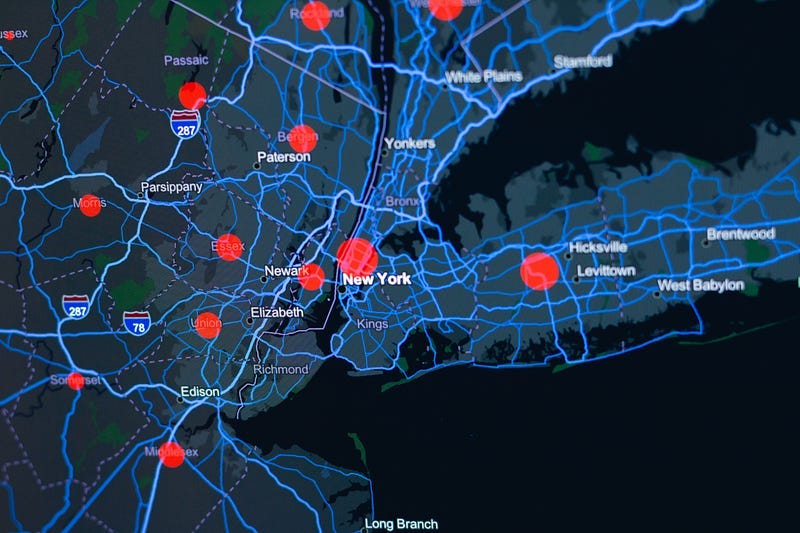 Creating Geospatial Heatmaps With Python’s Plotly and Folium Libraries
 4 Essential Tools to Help You Select a Colour Palette for Your Data Visualisation
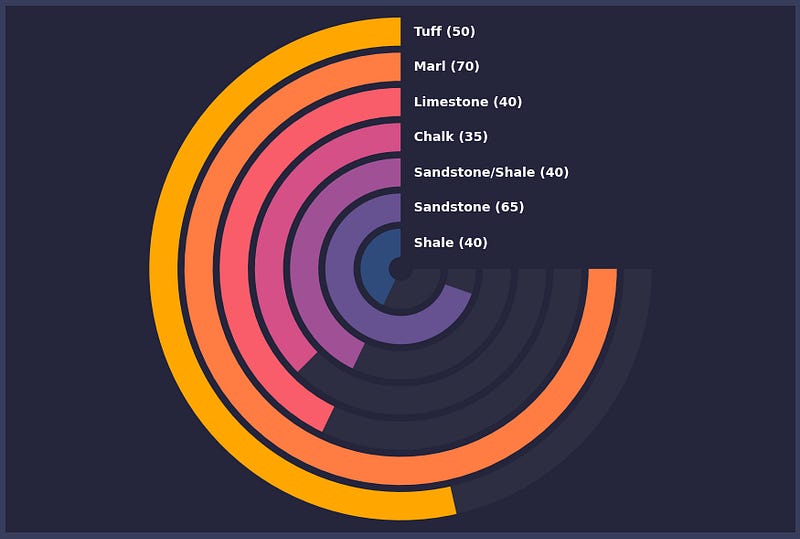 Create Eye-Catching Radial Bar Charts With Matplotlib
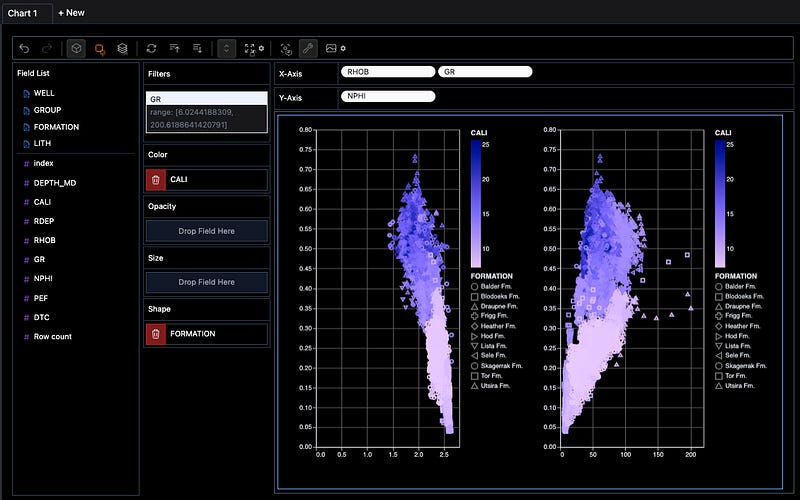 Using PyGWalker to Enhance Your Jupyter Notebook EDA Experience
 Building a Medium Stats Tracker With Streamlit
 How to Display Data From GeoJSON Files Using the Folium Python Library
 Sketch: A Promising AI Library to Help With Pandas Dataframes Directly in Jupyter
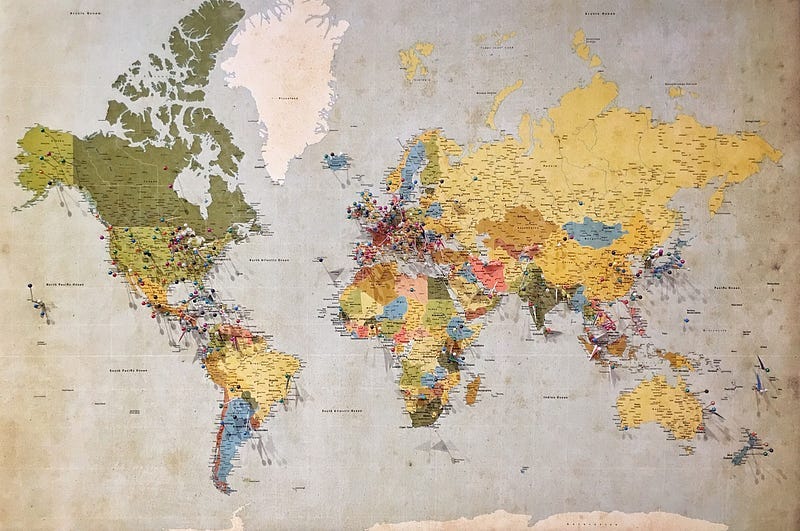 3 Easy Ways to Include Interactive Maps in a Streamlit App
 5 Powerful Python Libraries For EDA You Need to Know About
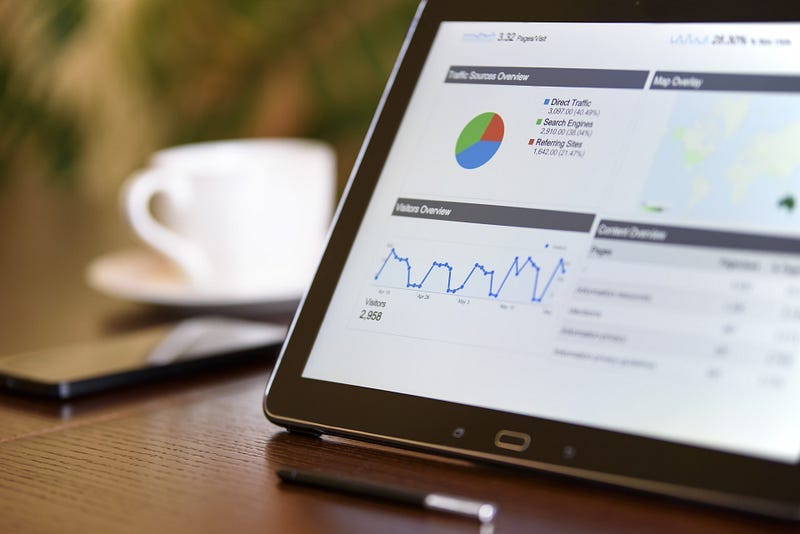 D-Tale for Fast and Easy Exploratory Data Analysis of Well Log Data
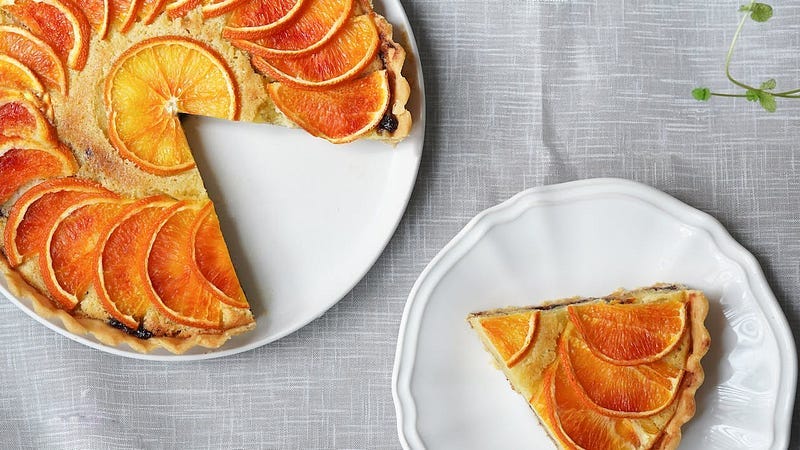 9 Creative Alternatives to the Traditional Pie Chart for Data Visualisation
 How to Create Beautiful Waffle Charts for Data Visualisation in Python
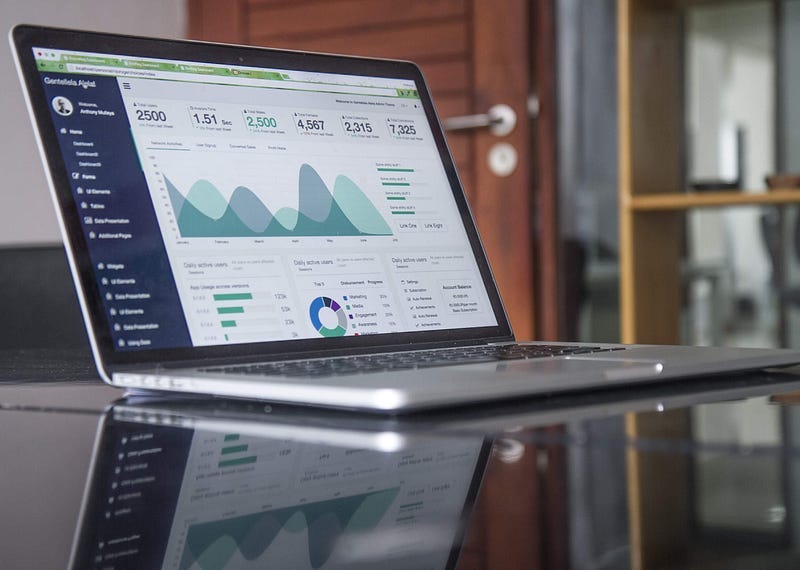 Building a LAS File Data Explorer App with Streamlit
 Learning Python With ChatGPT
 Uploading and Reading Files with Streamlit
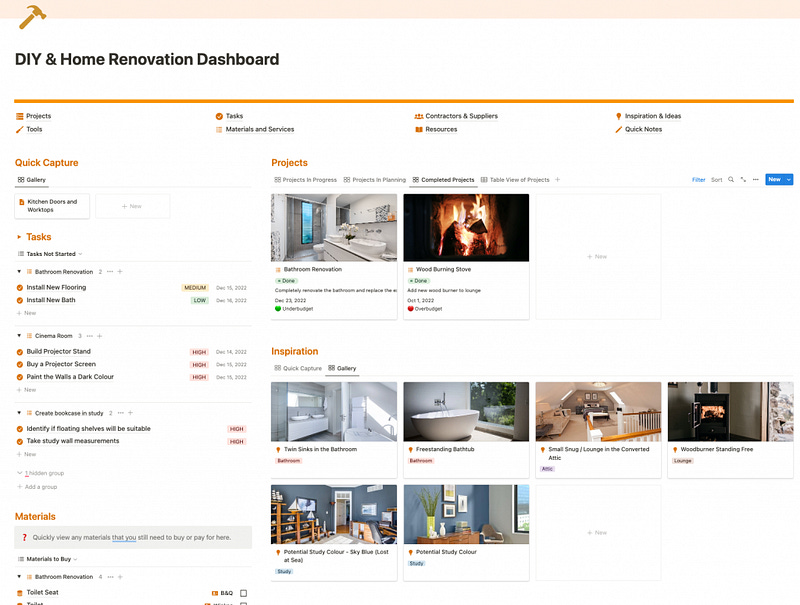 Notion for Home Renovation and DIY
 How to Use Streamlit’s st.write Function to Improve Your Streamlit Dashboard
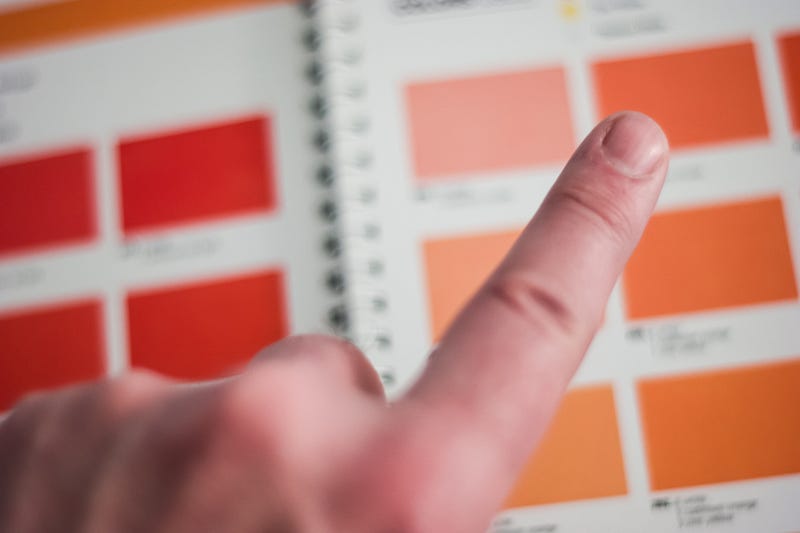 The Streamlit Colour Picker: An Easy Way to Change Chart Colours on Your Streamlit Dashboard
 ChatGPT: Building an Online Course Using AI
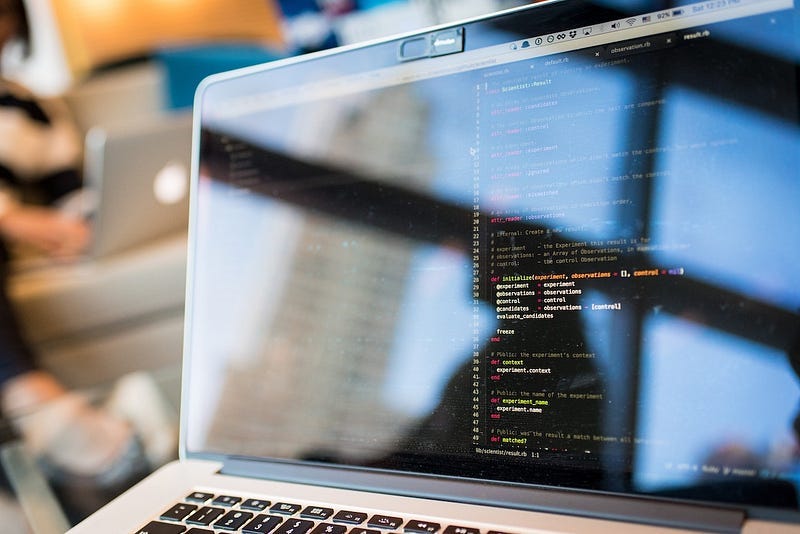 Getting Started With Streamlit: 5 Functions You Need To Know When Starting Out
 5 Great Data Science Side Hustles to Explore in 2023
 OpenAI’s Amazing ChatGPT: Is It Promising for Niche Topics?
 7 Useful Pandas Display Options You Need to Know
 How to Level up Your Pandas Skills in 5 Easy Ways
 k-Nearest Neighbors for Lithology Classification from Well Logs Using Python
 Creating a Multi-Well Integrated Well Log and Formation Tops Dataframe in Python
 5 Essential Soft Skills to Succeed as a Data Scientist
 How to Create a Simple Neural Network Model in Python
 Folium Mapping: Displaying Markers on a Map
 Data Quality Considerations for Machine Learning Models
 Isolation Forest — Auto Anomaly Detection with Python
 4 Ways I’m Using Data Science Skills to Generate Income From Side Hustles
 5 Ways to Transform Your Seaborn Data Visualisations
 Working with Well Trajectories in Python
 Combining Formation Data With Well Log Measurements in Pandas
 7 Simple Ways To Enhance Your Matplotlib Charts
 Random Forest Regression for Continuous Well Log Prediction
 Random Forest for Lithology Classification From Well Log Data
 Seaborn Heatmap for Visualising Data Correlations
 Using Notion for Data Science
 K-Means Clustering — An Introduction
 7 Tips To Get You Off To A Great Start When Learning Python
 6 Machine Learning Algorithms to Know About When Learning Data Science
 5 Essential Tips to Improve the Readability of Your Python Code
 Use Seaborn FacetGrid to Quickly Create Figures With Subplots
 Creating Boxplots with the Seaborn Python Library
 Using the Power of AI to Document Your Code
 Creating True Multi-Page Streamlit Apps — The New Way (2022)
 Seaborn Relplot in Python: Visualising Relationships in Data
 Getting Started With Streamlit Web Based Applications
 Pandas Profiling — Easy Exploratory Data Analysis in Python
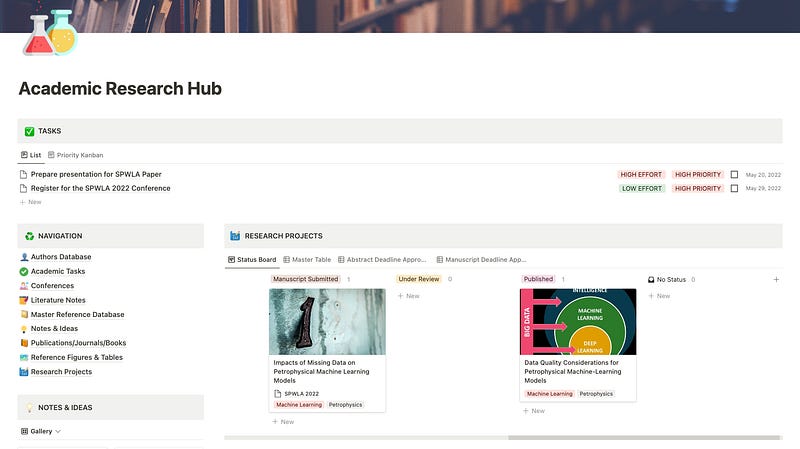 Notion for Academic Research Management
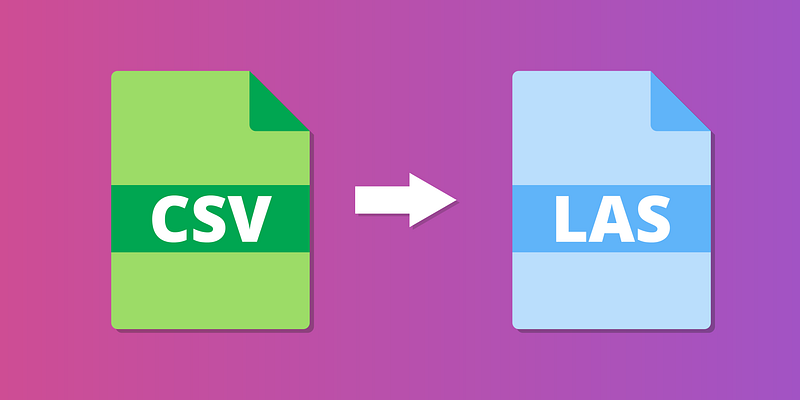 Convert CSV Files to LAS Files with Python
 Public Datasets for Machine Learning in Geoscience
 6 Python Libraries You Should Know About for Well Log Data & Petrophysics
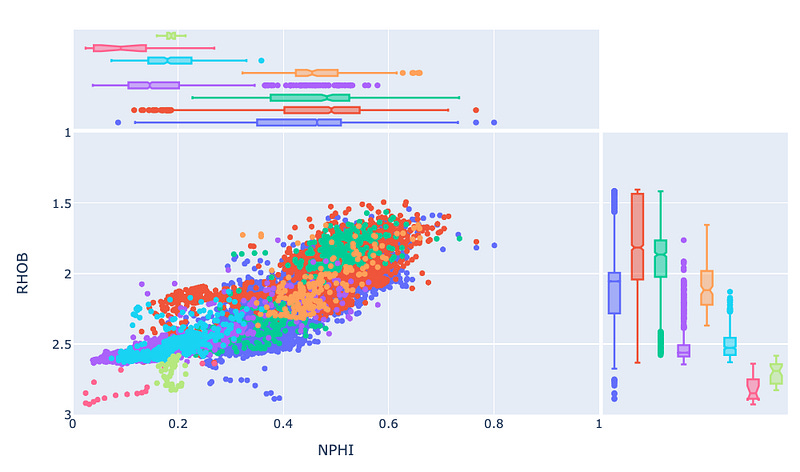 Enhance Your Plotly Express Scatter Plot With Marginal Plots
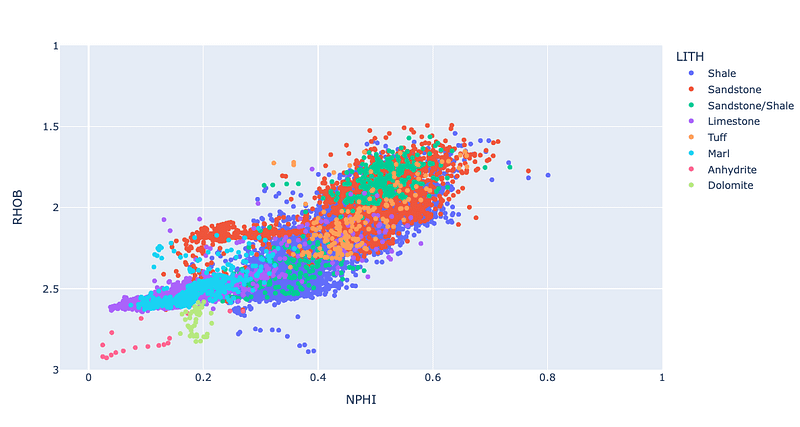 Using Plotly Express to Create Interactive Scatter Plots
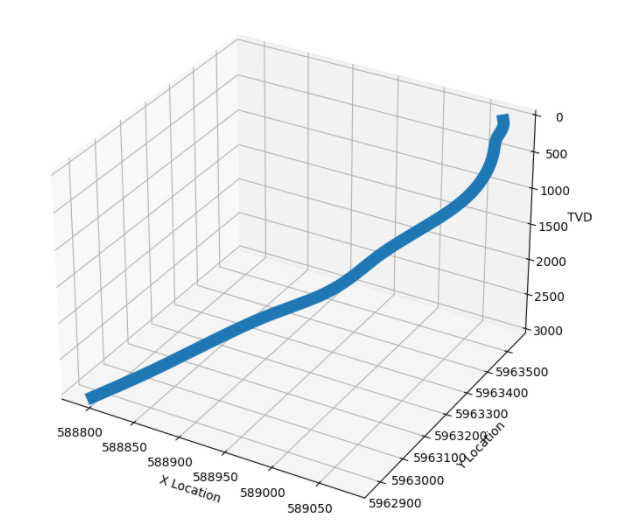 Visualizing Well Paths With The Welly Python Library
 Well Log Data Outlier Detection With Machine Learning and Python
 Identifying and Handling Missing Well Log Data Prior to Machine Learning
 Exploring Well Log Data Using Pandas, Matplotlib and Seaborn
 How to Rename Columns in Pandas — A Quick Guide
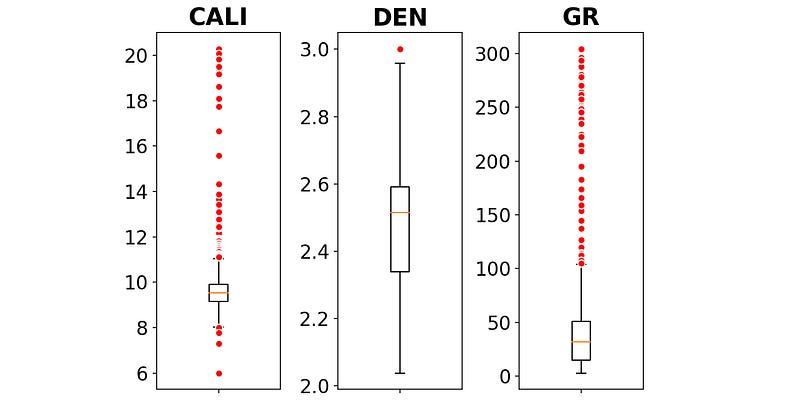 Creating Boxplots of Well Log Data Using Matplotlib in Python
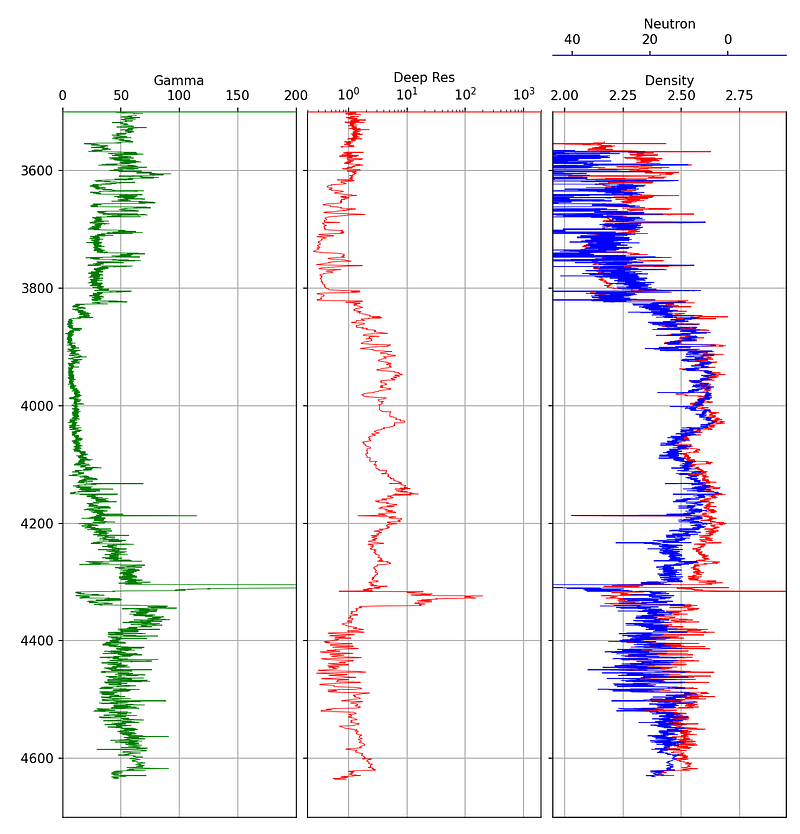 Creating Simple Well Log Plots Using the Matplotlib Library in Python
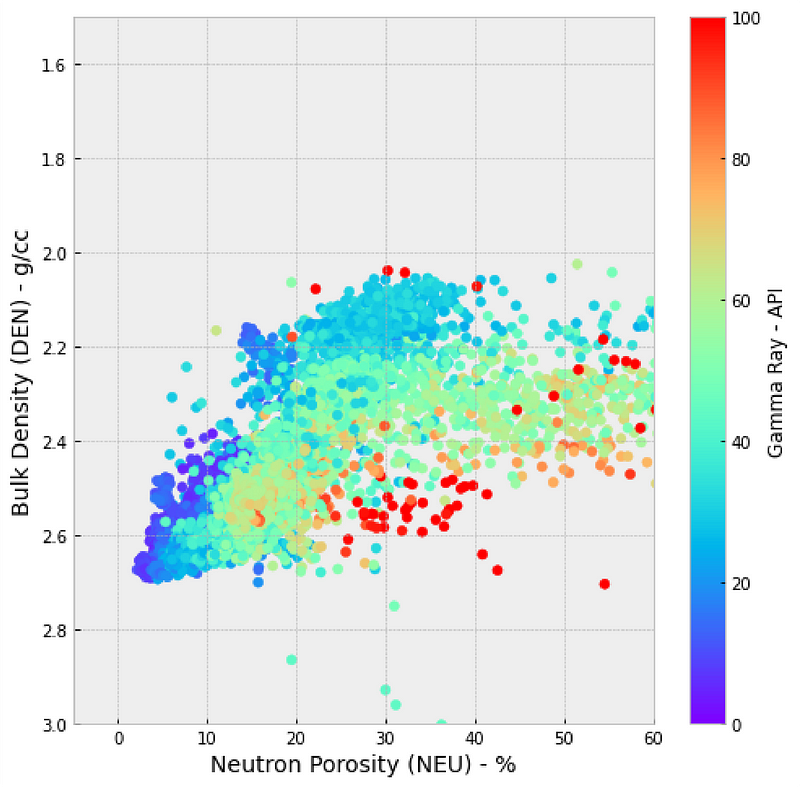 Creating Scatter Plots (Crossplots) of Well Log Data using Matplotlib in Python
 Using Histograms to Visualise Well Log Data
 10 Applications of Machine Learning Within Petrophysics
 Exploring Well Log Data Using the Welly Python Library
 Using the missingno Python library to Identify and Visualise Missing Data Prior to Machine Learning
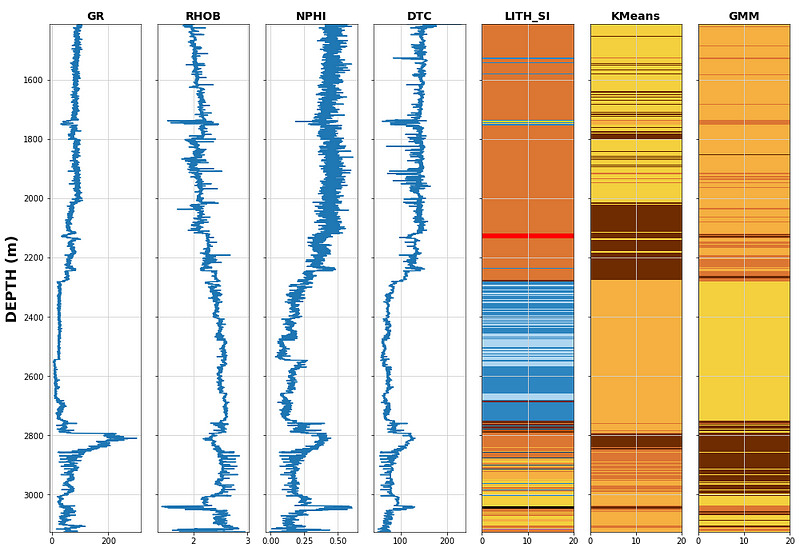 How to use Unsupervised Learning to Cluster Well Log Data using Python
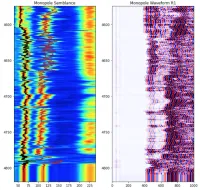 Loading Well Log Data From DLIS using Python
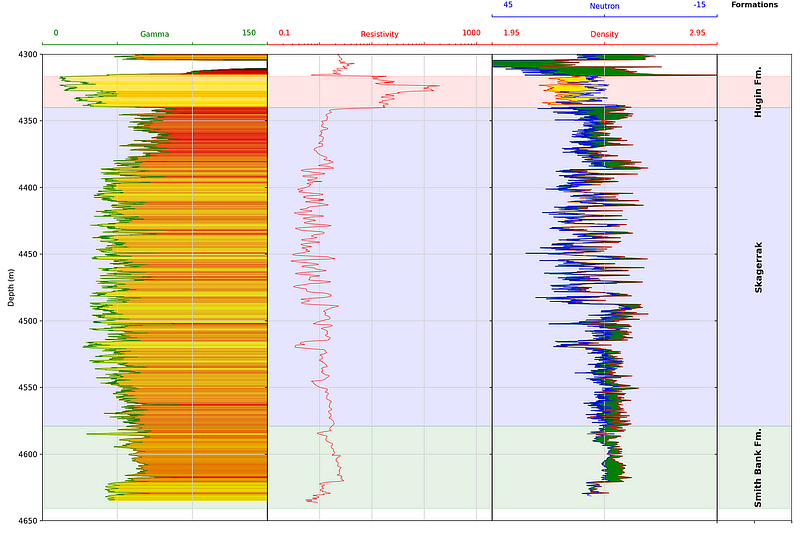 Adding Formation Data to a Well Log Plot
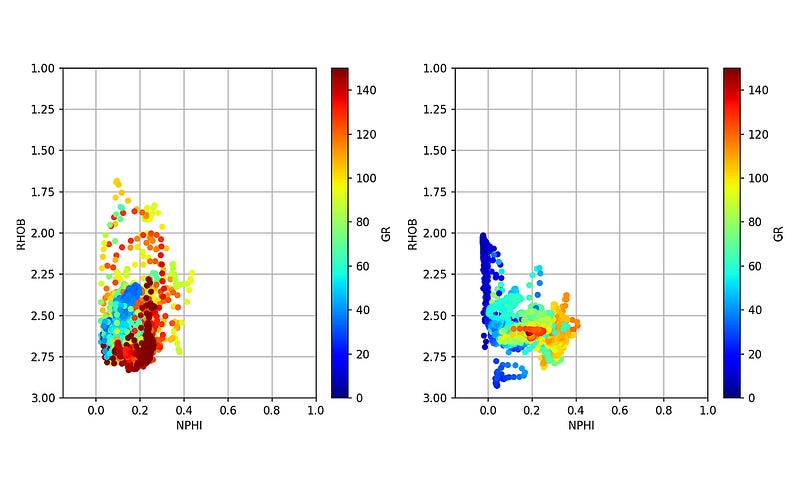 Loading Multiple Well Log LAS Files Using Python
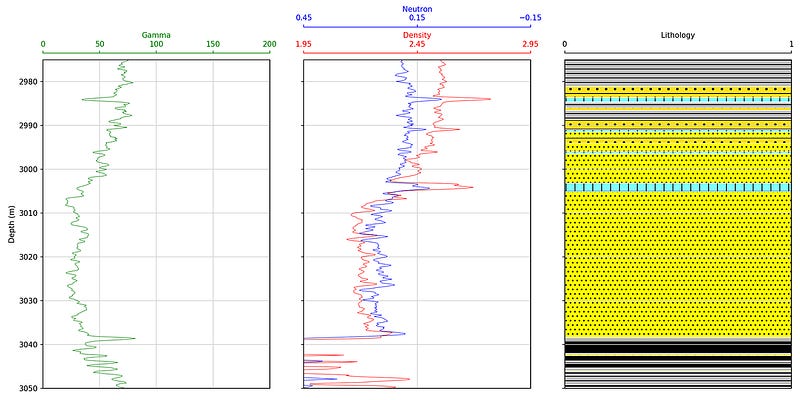 Displaying Lithology Data Using Python and matplotlib
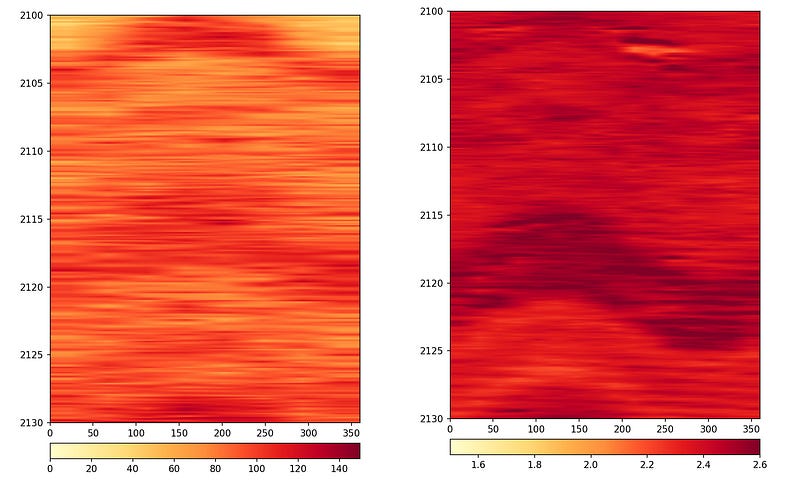 Displaying Logging While Drilling (LWD) Image Logs in Python
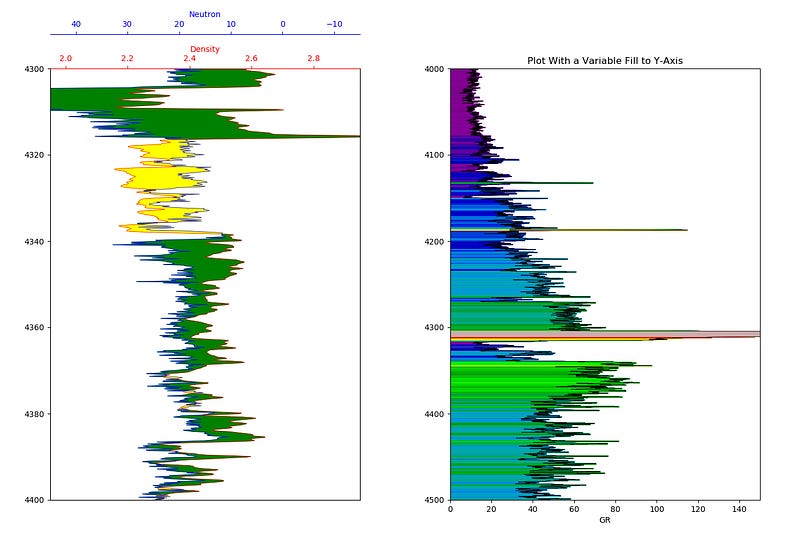 Enhancing Visualization of Well Logs With Plot Fills